
Exploring the Militarization of US Police Forces
The United States Defense Department’s 1033 program began in 1997, it allows for the transfer of excess military equipment to civilian law enforcement agencies. Most of the equipment obtained is justifiable, things such as cold weather clothing, diesel generators and flashlights. However, a significant portion of it is explicitly combat-oriented in nature, equipment such as M-16 rifles, tanks, and mine-resistant vehicles.
In 2014 the New York Times filed a freedom of information act request and received data from the Pentagon on all acquisitions since 2006. The data was made public by the NYT, it can be found here. The data is on an item purchase level, it has the state and county an item was purchased in, the item’s NATO stock number, the item’s name, how much it costs, how many were bought and the date of purchase.
Out of all of money spent by civilian law enforcement agencies through the 1033 program from 2006-2014 $609,879,850, 48% of the total, was spent on combat-oriented equipment. The rest of this analysis was produced using the combat-oriented subset.
Some Notable Acquired Items
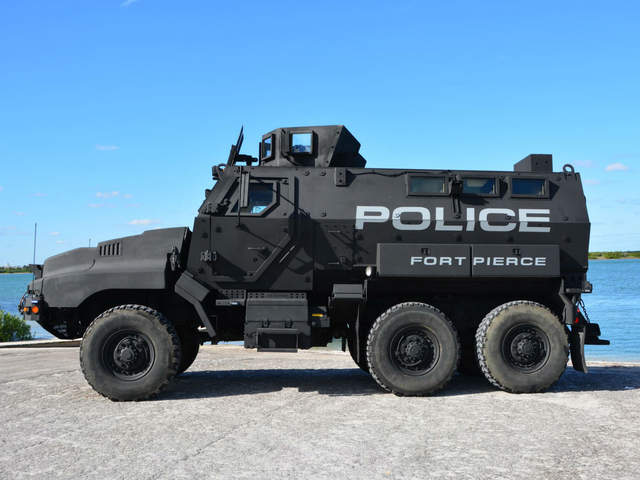
Combat Wheeled Vehicle
98 aquired
$45,080,000 total
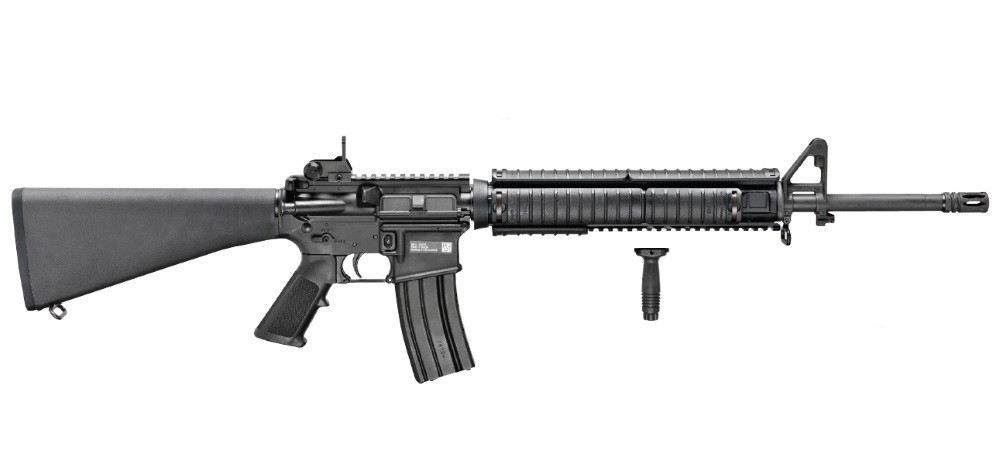
5.56mm Rifle
61,548 acquired
$30,712,452 total
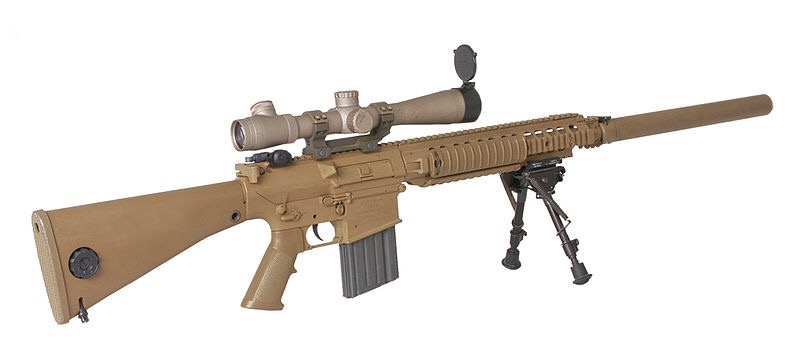
7.62mm Rifle
17,726 aquired
$2,446,188 total
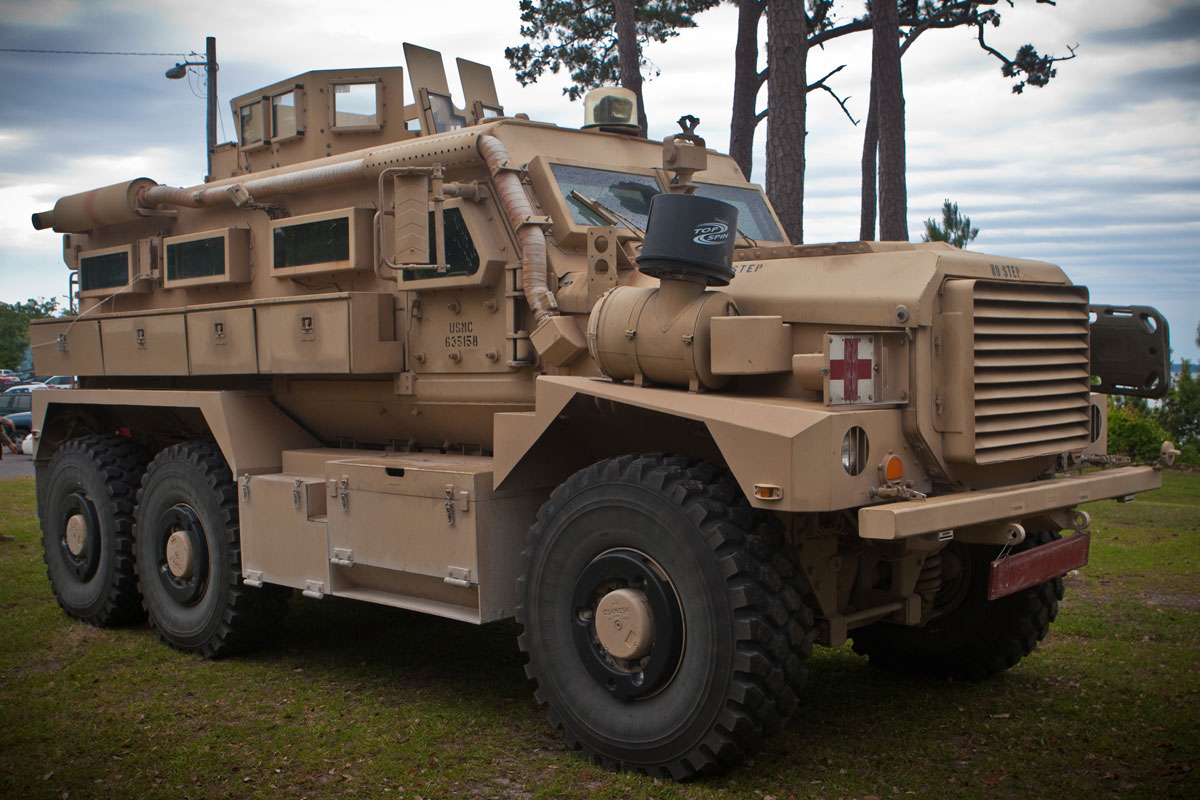
Mine Resistant Vehicle
341 acquired
$140,492,000 total
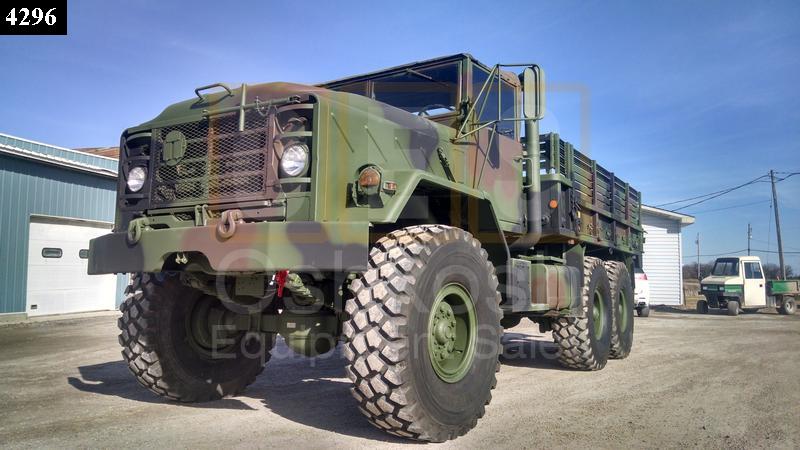
Truck/Van
173 acquired
$25,206,100 total
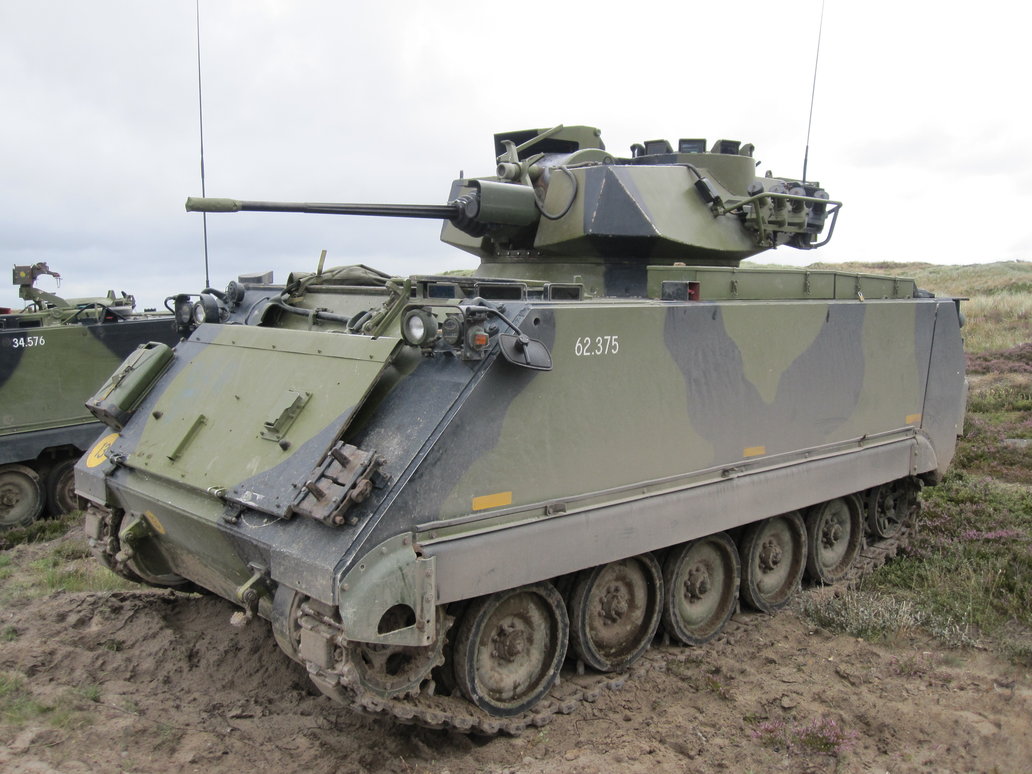
Fully Tracked Personnel Carrier
53 acquired
$12,976,732 total
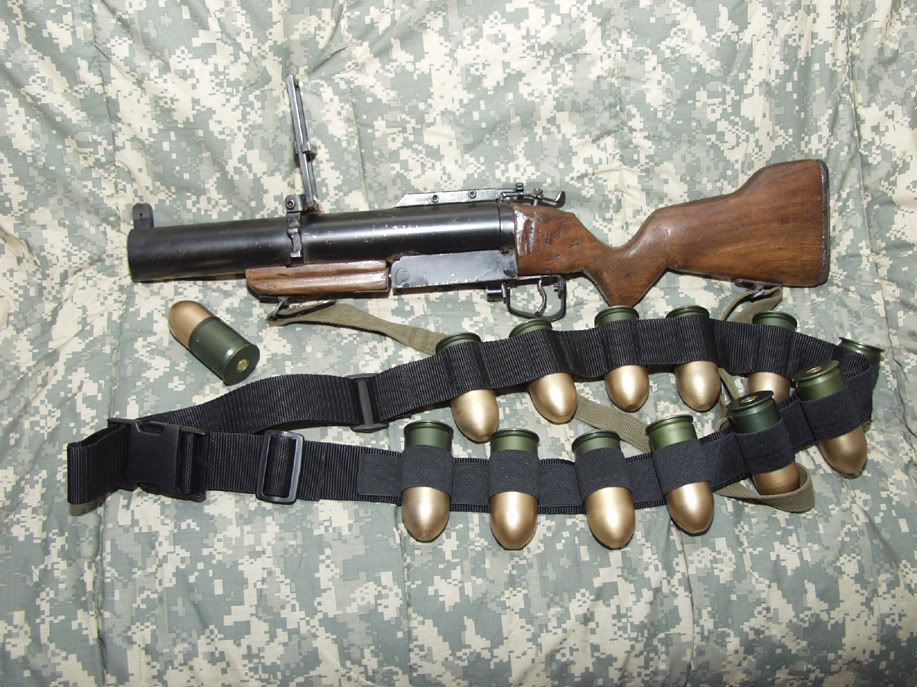
Grenade Launcher
205 acquired
$147,600 total
State-Level Analysis
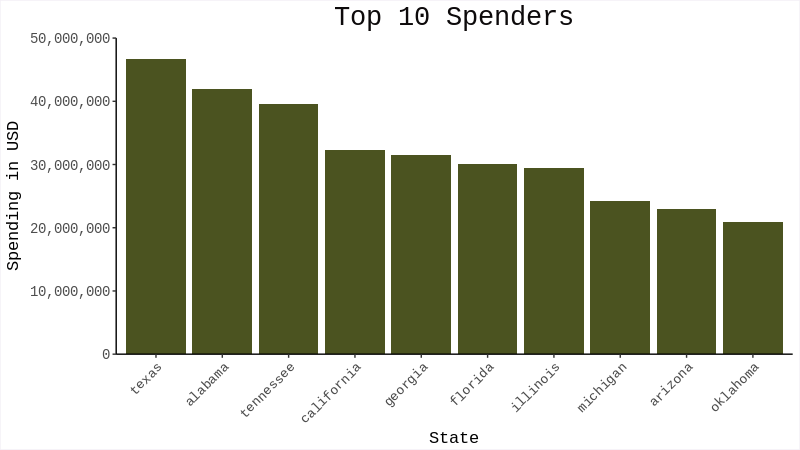
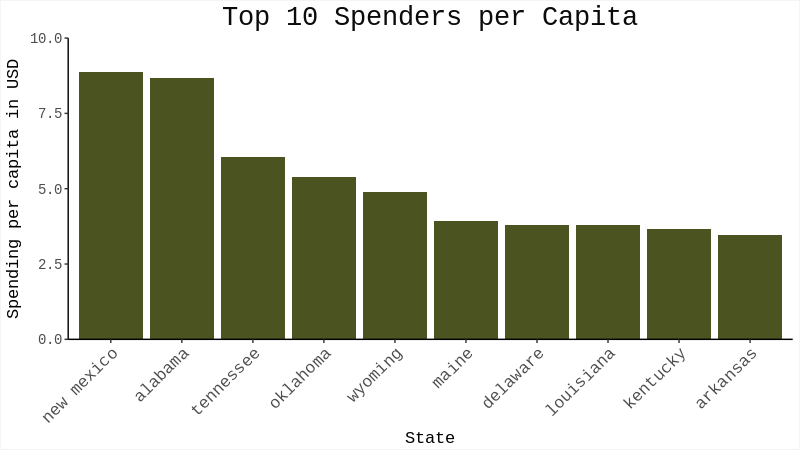
Alabama, Tennessee and Oklahoma are notable outliers, they are all in the top-10 before and after adjusting for population.
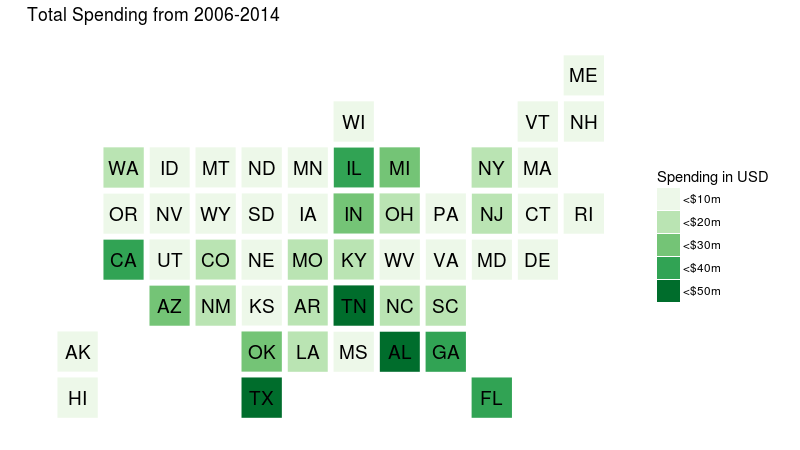
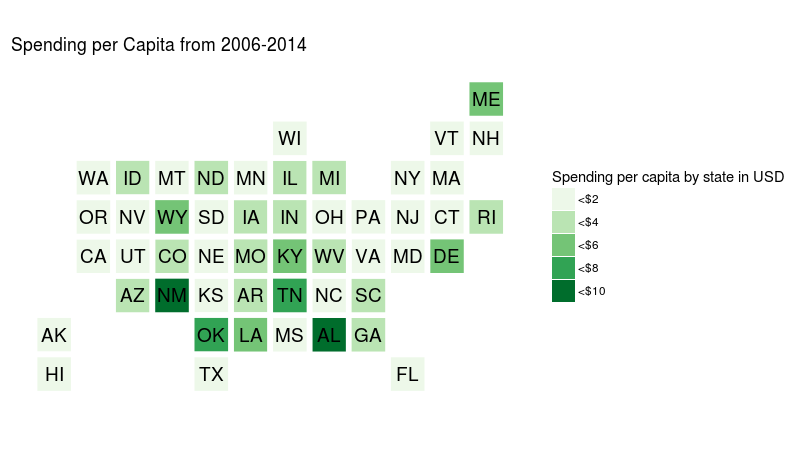
We can see that the southern and central states have more spending than the coasts.
County-Level Analysis
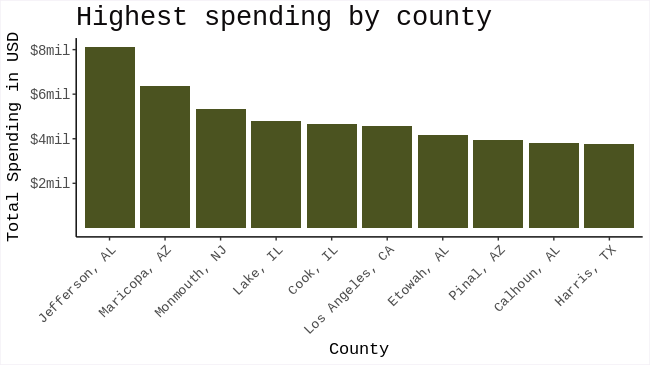
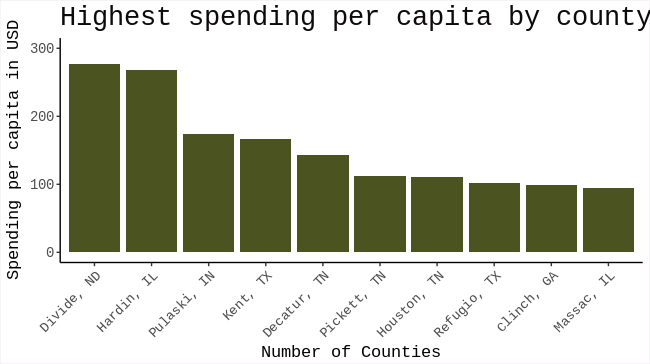
Most of these counties are very rural with populations under 5000, a couple large purchases (such as 2 tanks and 4 trucks in the case of Divide, ND) give them their high spending per capita.
Relationship with Other Socioeconomic Factors
Using data on a county level from three different sources we can examine the relationship between how much counties spent on militarized equipment and socioeconomic factors such as poverty rates, racial data and median earnings.
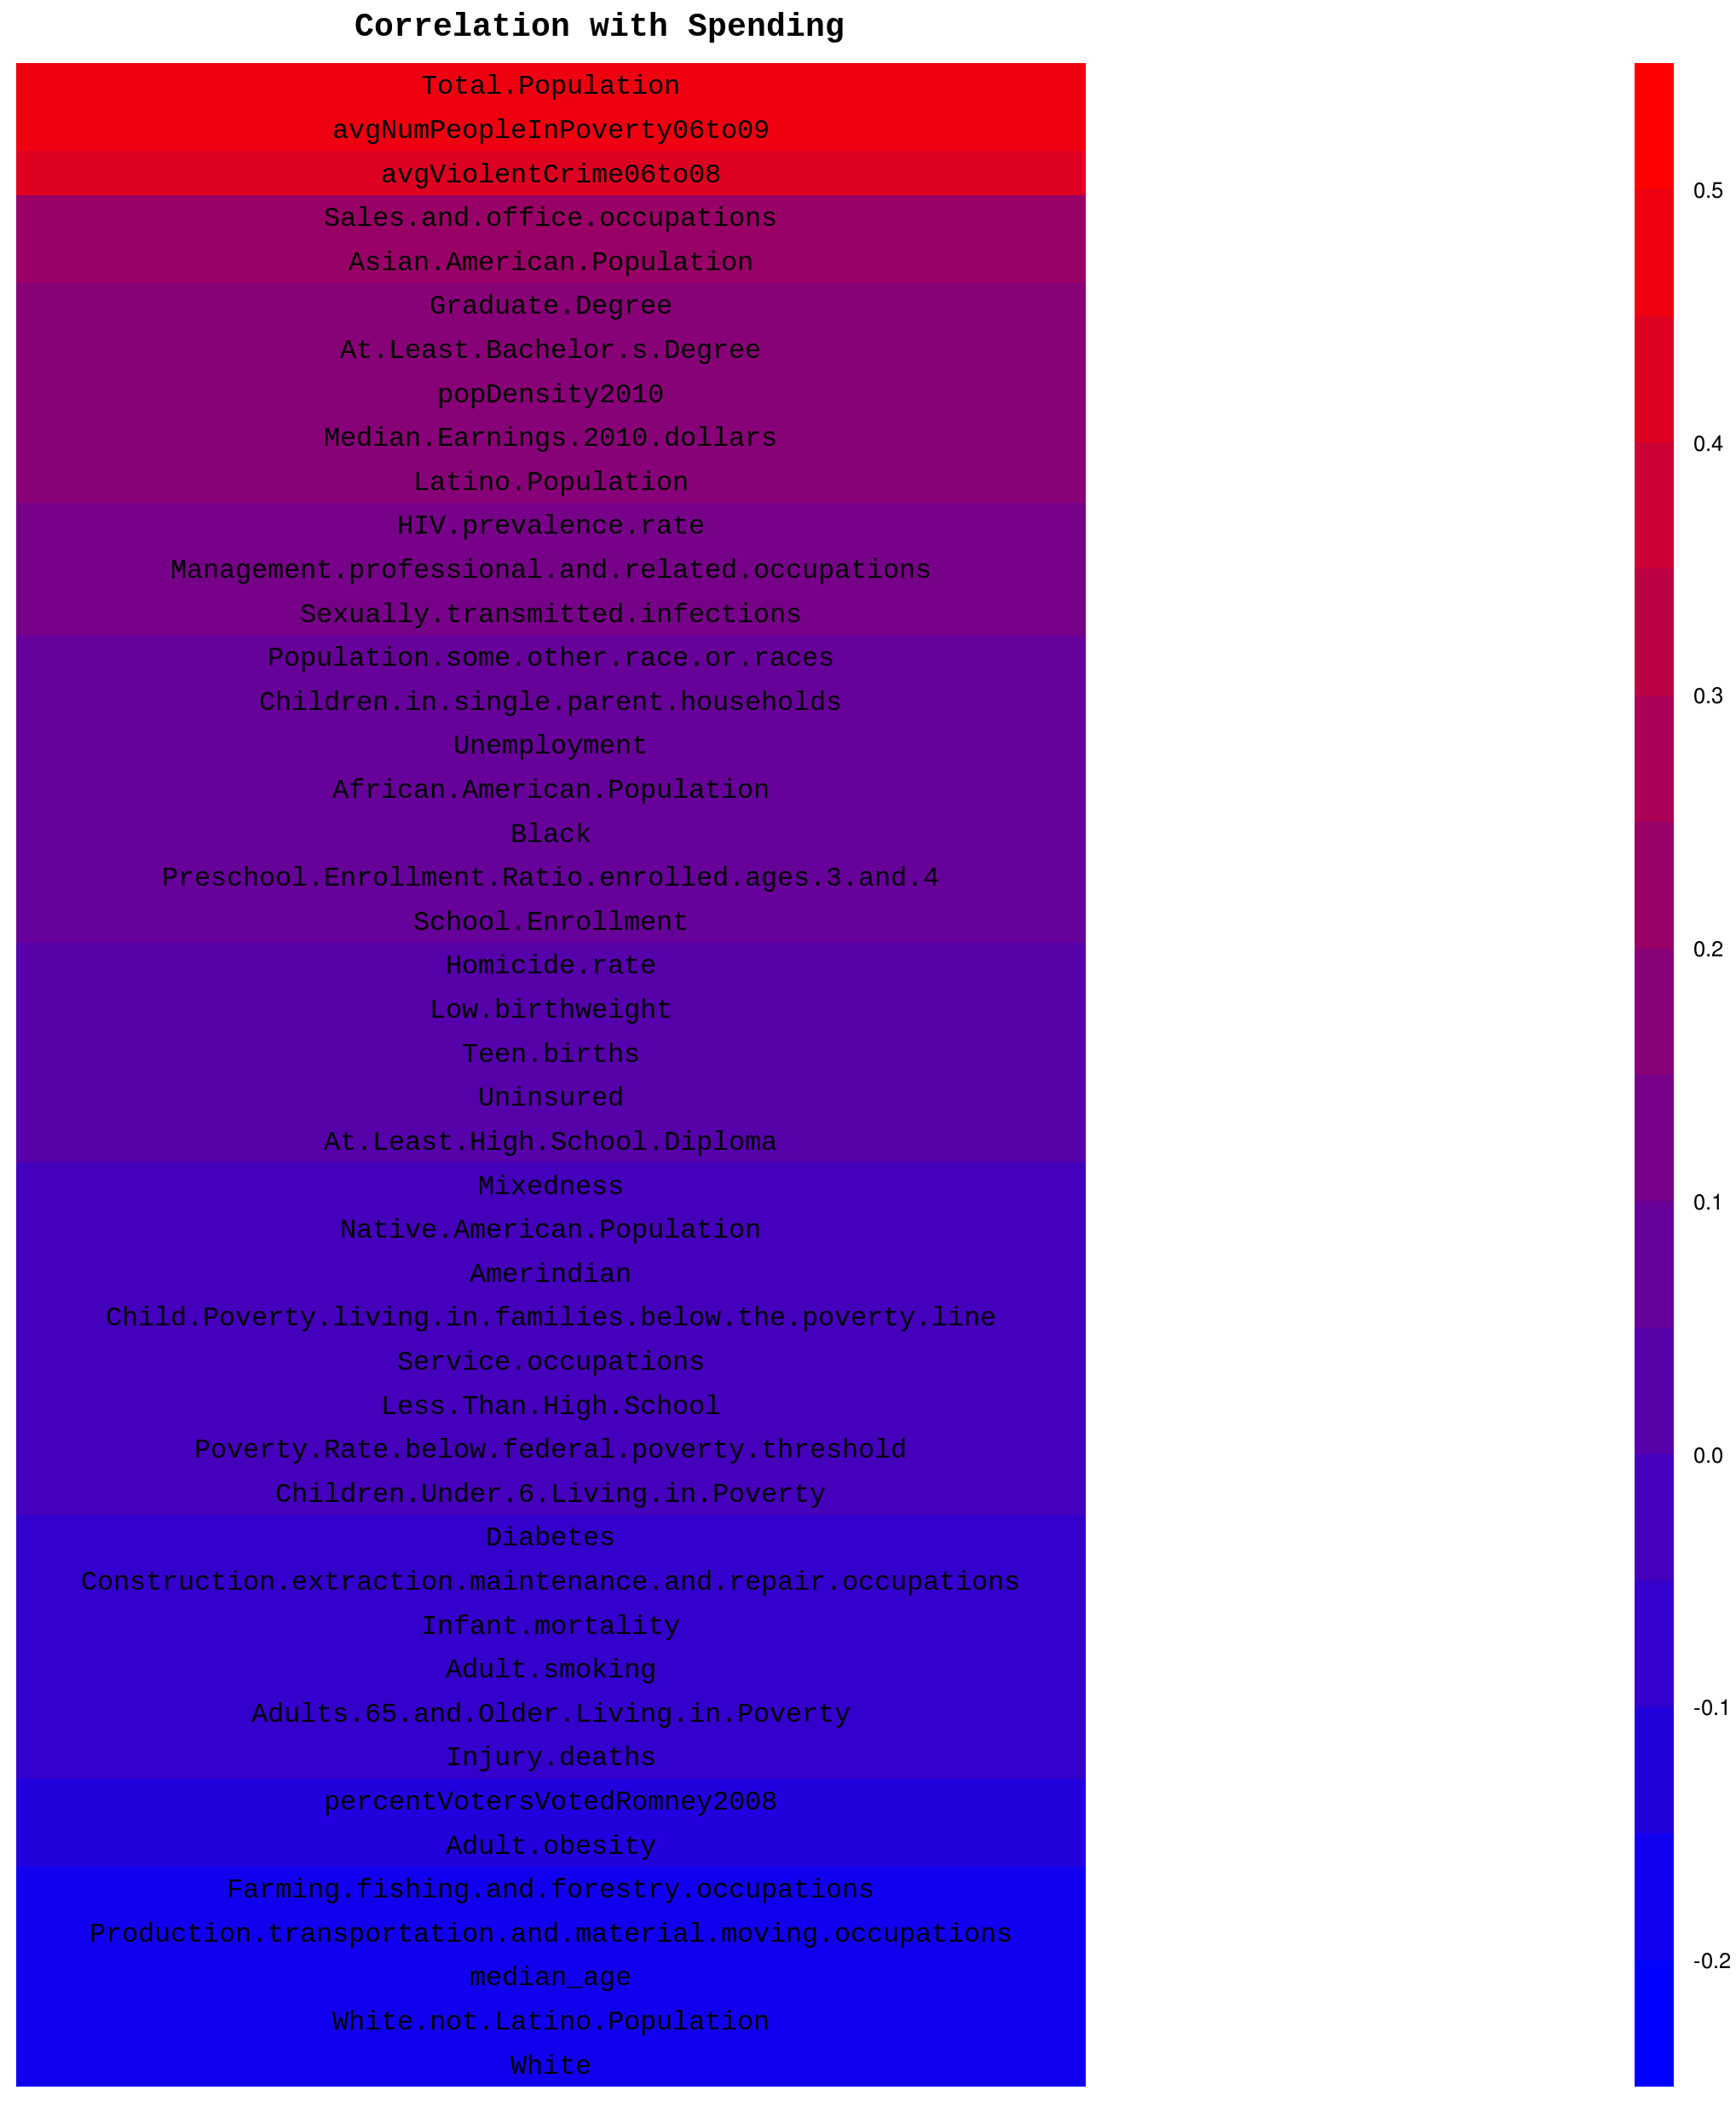
Most of the factors have correlations that are close to 0 which means they probably do not have any relationship at all with spending.
The most telling factors are the top three. The positive correlation of total population and spending is somewhat intuitive, however the positive correlation of crime and poverty with spending is more interesting. What this tells us is that poorer, more crime-ridden counties tend to have higher spending on combat-oriented equipment.
We also see that whiter, more rural and older counties slightly tend to have less spending while more educated and urban counties slightly tend to have more.
Reference
For more information please see the R markdown file and github repo for this analysis.